The essential terminal commands for your server
The toolbox for the server terminal: from htop, btop and ncdu for debugging to tmux, rsync and dig for daily work – with real examples.
Table of contents
Whoever runs their own server lives (at least occasionally) in the terminal. This article is your toolbox: the commands you really need – once for debugging when the server suddenly crawls, and once for daily work. Not a dry manual, but the selection that has proven itself in everyday use.
What are we building?
No setup this time, but a battle-tested reference. We go through two toolboxes:
- Debugging performance – when the server gets sluggish:
top,htop,btop,ctop,iotop,nload,ncduandkill. With these you find out what is eating the resources, and intervene. - Daily work – the commands you type constantly:
ls,cd,nano,wget,curl,dig,tmux,history,sudo,scp,rsync,ddandssh-agent.
All examples ran on a real Debian 13 server; the outputs shown are real. The interactive full-screen tools (top, htop, btop, ctop, nload, ncdu) we additionally show you in a picture, so you recognize the interface – the copyable single commands stay deliberately as text to type out.
Prerequisites
- A server you can log into via SSH – e.g. from First steps with the netcup VPS.
- A user with
sudorights to install packages. - No fear of the command line – we’ll shed that together here.
Install first, then use
top, kill, ls, curl, dig, scp, dd and ssh-agent are usually already there
on Debian. The more comfortable tools you install in one go:
sudo apt update && sudo apt install -y htop btop iotop nload ncdu tmux rsyncctop is not in the package sources – we’ll fetch it directly as a ready-made file in the
corresponding section.
Step by step
First the debugging toolbox – the commands for the moment the server is stuck. Then the tools for daily work.
top and htop: the first look
top is present on every Linux and shows the running processes live, sorted by CPU load.
For a quick look it’s enough:
top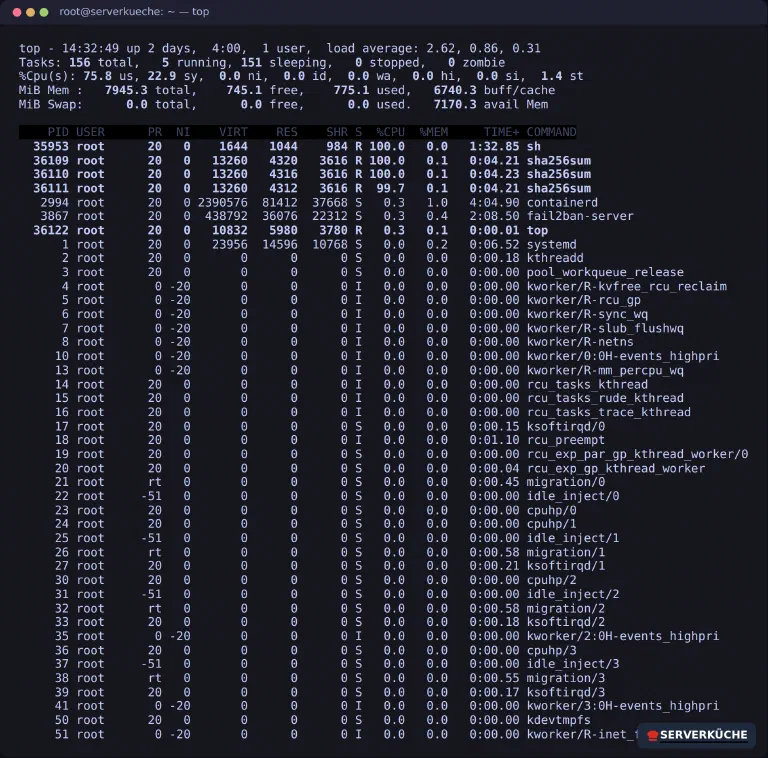
At the top you see load average, memory and the process list. The most important – and
most cryptic – line is %Cpu(s). Its eight values tell you what the CPU is busy
with:
us(user) – normal programs in userspace (your apps, container processes).sy(system) – the kernel itself (system calls, drivers, network stack).ni(nice) – userspace processes with lowered priority (started vianice).id(idle) – idling. Highid= plenty of headroom, lowid= the CPU is maxed out.wa(io-wait) – the CPU is waiting for the disk. Consistently high means: your bottleneck is the disk, not the compute power (then continue withiotop, see below).hi(hardware interrupts) – time for hardware interrupts (devices reporting in).si(software interrupts) – time for software interrupts (often network processing).st(steal) – only on VPS/virtual servers: compute time the hypervisor “stole” from your VM because other guests ran on the same host. Consistently highstmeans the host is oversubscribed – a reason to question the plan or provider.
With q you quit the view. But top is spartan – the successor htop is much more
readable: colored bars per CPU core, mouse operation and easy sorting.
htop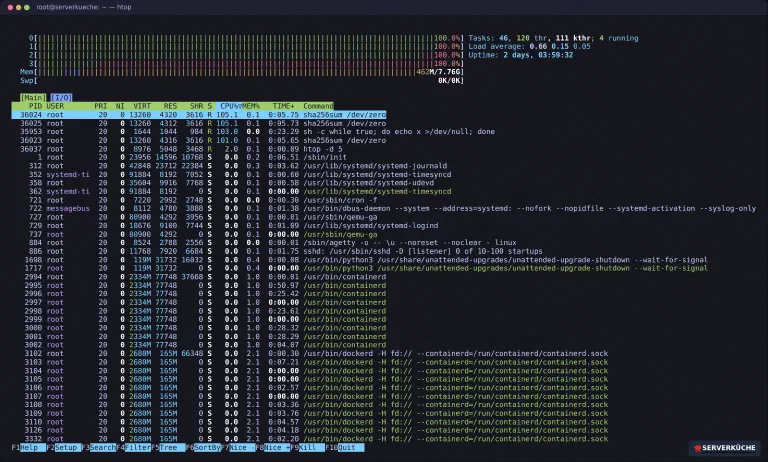
At the top, watch the CPU bars (one bar per core) and the Mem bar. In the list you
sort with F6 by a column (e.g. %MEM), search a process with F3 and end it with F9.
Exactly here you find the service that’s currently slowing everything down.
btop: the fancy system monitor
btop (version 1.3.2 from the Debian 13 package sources) goes one step further: CPU,
memory, disk I/O and network in one pretty, mouse-operable dashboard – all at a glance.
btop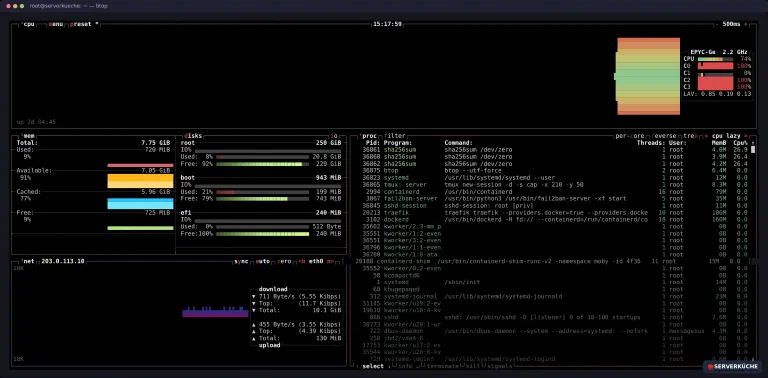
For the daily health check, btop is our favorite because you see network and disk right
along and don’t need several tools. Quit with q. Esc does not quit – it opens the
main menu (options, help, quit); a second Esc closes it again.
ctop: monitor Docker containers live
If you have Docker installed, you want to know which
container draws how much.
htop only shows processes – ctop shows containers. It’s not in the package sources, so
we fetch the ready-made file (version 0.7.7):
sudo curl -L -o /usr/local/bin/ctop https://github.com/bcicen/ctop/releases/download/v0.7.7/ctop-0.7.7-linux-amd64
sudo chmod +x /usr/local/bin/ctop
We deliberately download the file with a full path and make it executable – no blind
curl … | bash. Then you simply start it:
ctop
You get one row per container with CPU, RAM, network and disk I/O, updated live. With Enter on a container you open a menu to stop, restart or show logs – ideal when a single service runs amok.
iotop and nload: disk and network
Sometimes the problem isn’t the CPU but the disk. iotop shows which process is
currently reading and writing (needs root):
sudo iotopSorted by write/read rate you immediately spot the I/O hog – often a backup, a database or
a log gone out of control. For the network, nload does the same: incoming and
outgoing throughput in real time, with a small graph.
nload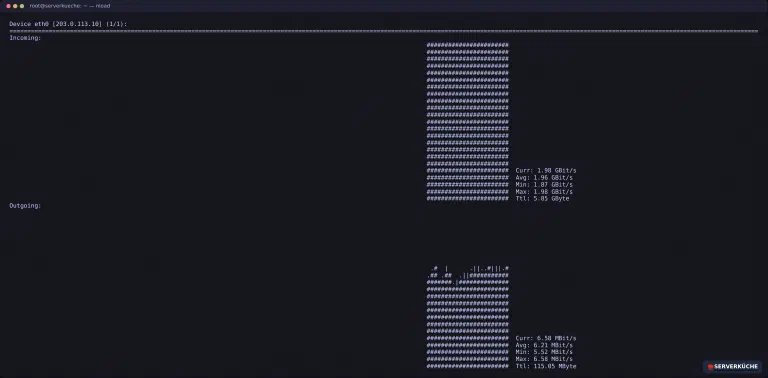
With the arrow keys you switch between the network interfaces (or you specify the desired
one directly, e.g. nload eth0). Handy to check whether a large upload is running – or
whether unexpected traffic is clogging the connection.
ncdu: find the storage hog
The most common cause of a broken server is a full disk. The rough overview is given by
df:
df -h /Filesystem Size Used Avail Use% Mounted on
/dev/vda4 251G 11G 230G 5% /df tells you that it’s getting tight, but not where. That’s what ncdu does – an
interactive directory analyzer that shows you which folders take up the space:
sudo ncdu /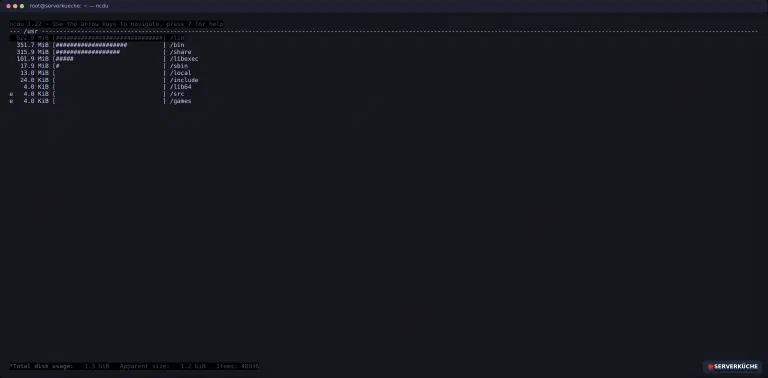
ncdu scans and lists the largest directories at the top. With the arrow keys you navigate
in, with d you delete specifically (careful!). This is how you find the huge log file or
the forgotten backup folder in seconds.
kill: end hanging processes
If in htop or top you found the PID (process ID) of the culprit, you end it with
kill:
kill 12345That sends a polite “please quit” (signal TERM) that allows the process to clean up
properly. If it doesn’t react, the hard variant follows:
kill -9 12345-9 (signal KILL) ends immediately and mercilessly. Use it only as a last resort –
the process can no longer save any data. If you only know the name, pkill nginx helps,
which hits all matching processes.
That ends the debugging box. Now the tools for daily work.
ls, cd and nano: navigate and edit
The basic framework of every terminal session. cd changes the directory, ls lists the
contents. Most useful is ls with options:
ls -lh-l shows details (permissions, owner, size, date), -h makes the sizes readable (4.0K
instead of 4096). With ls -la you also see hidden files (those starting with .). For
editing configuration files, nano is the most beginner-friendly editor:
sudo nano /etc/hostsAt the bottom are the shortcuts: Ctrl+O saves (“Write Out”), Ctrl+X quits. No cryptic
vim – exactly right to quickly change a line.
wget, curl and dig: fetch data and check the network
wget downloads files – ideal for downloads:
wget https://YOUR_SOURCE/file.tar.gzcurl is the Swiss Army knife for HTTP. Especially valuable: viewing only the response
headers to check what a server returns:
curl -I https://example.comHTTP/2 200
date: Sat, 18 Jul 2026 09:55:49 GMT
content-type: text/html
server: cloudflareStatus 200 means “all ok”, 301/302 are redirects, 404 “not found”. For DNS
questions, dig is the tool – e.g. to check whether your domain points to the right
server:
dig +short example.com A172.66.147.243
104.20.23.154+short delivers only the pure answer (the IP address). Without the switch you see the
full report including response time – indispensable before Traefik can fetch a certificate
(see connecting a domain to your server).
tmux: the session that never breaks off
The most important tool for remote maintenance. If you start a long command (update,
backup, compiling) over SSH and your connection breaks, normally your process dies too.
tmux solves that: it keeps your session alive on the server, whether or not you’re
connected.
tmuxYou land in a tmux session and work normally. If the connection breaks off (or you
deliberately close with Ctrl+B, then D – “detach”), everything keeps running. On the
next login you attach again:
tmux attachtmux can do much more (split windows, several panes). The shortcuts all begin with the
“prefix” Ctrl+B. A compact overview of all shortcuts is on the
tmux cheatsheet – worth printing out.
scp, rsync and dd: copy and transfer
scp copies files over SSH – from the local machine to the server and back:
scp file.txt YOUR_USER@YOUR_SERVER_IP:/opt/target/For anything beyond single files, rsync is superior: it transfers only changes, can
resume, and synchronizes entire directory trees. Always test first with -n (dry run)
before you really copy:
rsync -avn /source/ /target/sending incremental file list
created directory /target
./
file.txt
sub/
sub/more.txt
sent 140 bytes received 59 bytes 398.00 bytes/sec
total size is 11 speedup is 0.06 (DRY RUN)-a preserves permissions and timestamps, -v is verbose, -n only shows what would
happen. If it looks good, you leave out the -n. rsync also works over SSH
(rsync -av /source/ user@server:/target/) and is thus the backbone of many backup scripts.
dd, finally, copies raw, block by block – e.g. to write a boot image onto a USB
stick. It’s powerful and merciless (more on that below):
sudo dd if=image.iso of=/dev/sdX bs=4M status=progresshistory, sudo and ssh-agent: the little helpers
history shows your most recently typed commands with a number – handy to find a long
command from yesterday again:
history | grep dockerWith !123 you run the command with number 123 again, with Ctrl+R you search
interactively backwards. sudo runs a single command with administrator rights – always
only as much privilege as needed:
sudo systemctl restart dockerssh-agent, finally, remembers your SSH key password for the session so you don’t have to
retype it on every connection:
eval "$(ssh-agent -s)"
ssh-add ~/.ssh/id_ed25519
After that you log in without entering the passphrase again – until you log out. More on secure SSH keys is in hardening SSH.
When things go wrong
dd overwrote the wrong disk – data gone. dd doesn’t ask and isn’t mockingly called
“disk destroyer” for nothing. Check the target (of=) always beforehand with lsblk,
and never confuse sda with sdb. There’s no undo – when in doubt, read it three times.
kill -9 ended a service, but the database is corrupted afterwards. -9 gives the
process no chance to close cleanly. Always first use kill without -9 and give the
process a few seconds. Only when it really hangs does the hard variant follow.
rsync copied (or deleted) much more than expected. The trailing slash decides:
rsync -a /source/ copies the contents of source, rsync -a /source copies the
folder along with it. And --delete deletes everything in the target that’s missing in
the source. Test with -n first, always.
A tool reports “command not found”. The package isn’t installed. Install it (see tip
box above) or check the name. Some tools like iotop additionally need sudo to see any
data at all.
After tmux, on the next login “everything is gone”. You started a new session
instead of attaching. tmux ls lists running sessions, tmux attach -t 0 attaches you to
the first. Just tmux on its own creates a fresh one every time.
Your problem is not listed? Search all error messages →
Maintenance & backups
- These commands are your backup tool.
rsync,scpandddare the foundation of every backup strategy. For real, encrypted off-site backups you build on this – see backups with Restic, which internally uses the same logic. - Help yourself. Every command brings its own docs:
man rsyncopens the manual,rsync --helpshows the options compactly. For brief practical examplestldris worth it, which instead of pages-long man pages shows the three or four most common use cases. There is no package calledtldrin Debian 13 (aptanswers withPackage 'tldr' has no installation candidate) – the command lives in thetealdeerpackage. Install it withsudo apt install -y tealdeer, then runtldr --updateonce (it downloads the example collection, otherwise you only getPage cache not found). After that,tldr rsyncshows the typical invocations on half a page. - Stay current. Keep the tools fresh via
sudo apt update && sudo apt upgrade;ctopyou update by downloading the new release file again. The versions are named deliberately (state of this guide) – newer ones generally work just the same. - Honest about the effort: you don’t have to memorize this reference. Bookmark it and come back when the server is stuck. After a few weeks the most important moves stick on their own.
Last updated: Oct 16, 2026
Send feedback: feedback@serverkueche.de
What's next?


You might also like