Healthchecks: Monitor Cron Jobs & Backups (Dead Man's Switch)
Notices when a backup does NOT run: Healthchecks monitors cron jobs via a dead man's switch and alerts on failure – self-hosted behind Traefik.
Table of contents
The most dangerous failures are the silent ones: the nightly backup hasn’t run for three weeks – and no one notices until the data is actually needed. Uptime Kuma tells you when a service is up. Healthchecks tells you when a job didn’t run. That difference is what saves data.
What are we building?
A self-hosted Healthchecks server (v4.4) behind Traefik that works as a dead man’s switch: every monitored job “checks in” after a successful run with a short HTTP ping. If that ping is missing (because the job crashed, the server was off, or the cron entry is gone), Healthchecks raises an alert. By the end you monitor your Restic backups, database dumps and any other recurring job with it – and get notified before the absence becomes a problem.
Prerequisites
- A server with Traefik running and Docker Compose
- A subdomain pointing at the server –
YOUR_DOMAINbelow - Recurring jobs worth monitoring (e.g. your Restic backups)
VPS 1000 G12.5
4 vCores · 8 GB RAM · 128 GB SSD
from €14.50/month
Healthchecks is frugal and runs happily alongside your other stack.
💶 €5 voucher for new netcup customers: (not for domains or VPS Lite)
Step by step
Step 1: Understand the principle – monitoring, inverted
Classic monitoring actively asks: “Does the service respond?” Healthchecks inverts that: the job checks in with the server. Each check has a unique ping URL. After a successful run the job calls that URL. Healthchecks expects the ping within a defined window (period) plus a tolerance (grace time). If the ping doesn’t arrive in time, the check goes “down” and Healthchecks alerts. That’s the dead man’s switch: it’s not the presence of a signal that triggers the alarm, but its absence.
Step 2: Create the Compose file
Healthchecks is a Django application; we run it with SQLite – perfectly sufficient for a typical self-hosting scale. Create the project:
mkdir -p /opt/healthchecks/data && cd /opt/healthchecks
chown -R 1000:1000 data
The compose.yaml – replace YOUR_DOMAIN and generate your own SECRET_KEY (openssl rand -hex 32):
services:
  healthchecks:
    image: healthchecks/healthchecks:v4.4
    restart: unless-stopped
    user: "1000:1000"
    volumes:
      - ./data:/data
    environment:
      SITE_ROOT: https://YOUR_DOMAIN
      SITE_NAME: Serverkueche Healthchecks
      ALLOWED_HOSTS: YOUR_DOMAIN
      CSRF_TRUSTED_ORIGINS: https://YOUR_DOMAIN
      DEBUG: "False"
      DB: sqlite
      DB_NAME: /data/hc.sqlite
      SECRET_KEY: "YOUR_RANDOM_KEY"
    networks: [proxy]
    labels:
      - "traefik.enable=true"
      - "traefik.http.routers.hc.rule=Host(`YOUR_DOMAIN`)"
      - "traefik.http.routers.hc.entrypoints=websecure"
      - "traefik.http.routers.hc.tls.certresolver=le"
      - "traefik.http.services.hc.loadbalancer.server.port=8000"

networks:
  proxy:
external: trueTwo traps: DB_NAME and no non-ASCII in SITE_NAME
DB_NAME: /data/hc.sqlite is mandatory – without the path Healthchecks creates the database in a non-writable location and fails to start with “unable to open database file”. And: keep SITE_NAME pure ASCII (no “ü”, “ö” …). A non-ASCII character in this environment variable causes a UnicodeEncodeError: surrogates not allowed on current Python – the page then responds with HTTP 500 (this exact bug hit me while testing this tutorial).Step 3: Start and log in
docker compose up -dThe image ships a health check; Traefik only routes once the container is healthy (about 20–30 seconds). Check:
docker compose psNAME IMAGE STATUS
healthchecks-healthchecks-1 healthchecks/healthchecks:v4.4 Up (healthy)Healthchecks does not ship an account – on start the image only sets up the database. So create your access once yourself (replace the password):
docker compose exec healthchecks python manage.py createsuperuser \
--email admin@YOUR_DOMAIN --password YOUR_STRONG_PASSWORDSuperuser created successfully.SUPERUSER_EMAIL has no effect
SUPERUSER_EMAIL and SUPERUSER_PASSWORD as environment variables in the
Compose file. The official image does not read them – its startup hook only runs
manage.py migrate. Anyone relying on that ends up at a login page with no account behind it
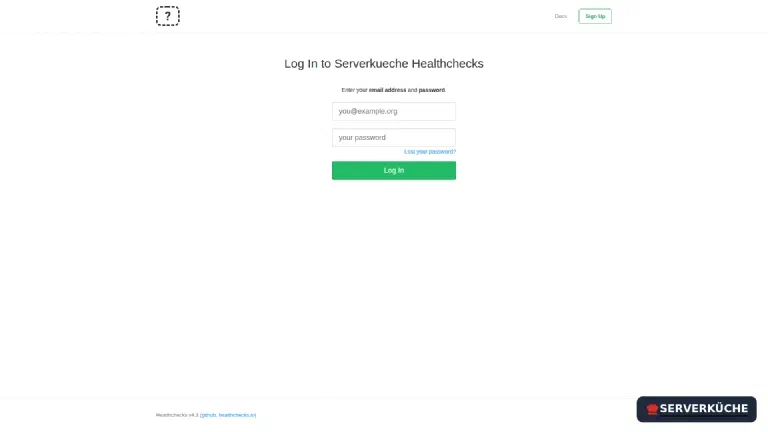
(tested with v4.3 and v4.4). The createsuperuser route above is the reliable one.Now open https://YOUR_DOMAIN/ and log in with those credentials:
Step 4: Create a project and your first check
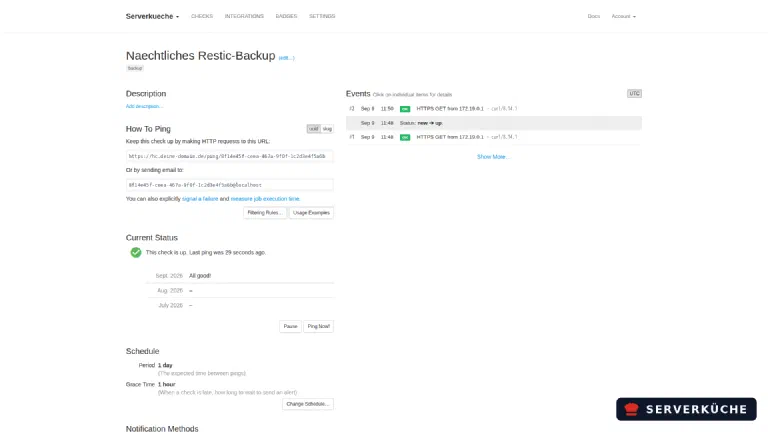
After login create a project via New Project… (e.g. “Serverküche”) and inside it a first check via Add Check. Give it a descriptive name, tags and a schedule – period = expected interval between two runs (for a daily backup: 1 day), grace time = how long Healthchecks waits after the due time before alerting (e.g. 1 hour). The overview shows all checks with status, ping URL and last ping:

Each check gets its own ping URL of the form https://YOUR_DOMAIN/ping/<UUID>. Clicking a check opens the detail page with instructions, history and status:
Step 5: Have a job send the ping
Now the core. You make your job call the ping URL after a successful run. The simplest example – at the end of your script:
curl -fsS -m 10 --retry 5 https://YOUR_DOMAIN/ping/YOUR_CHECK_UUID-fsS keeps curl quiet but reports errors; -m 10 aborts after 10 seconds; --retry 5 catches brief network hiccups. Even better: report the job’s exit code, so a failed run shows up as an error immediately instead of “no ping”:
#!/bin/bash
URL="https://YOUR_DOMAIN/ping/YOUR_CHECK_UUID"
# ... your actual job runs here ...
restic backup /important/data
# report the exit code to Healthchecks (0 = ok, otherwise failure)
curl -fsS -m 10 --retry 5 "$URL/$?"
Step 6: Monitor Restic backups
This is the showcase. If your Restic backups run via a systemd timer, you add the ping at the end of the backup script. If the backup doesn’t run (timer disabled, server off, script crashed), the ping is missing – and after the grace time expires, Healthchecks alerts. That way you learn about a dead backup within hours, not at data-loss time.
Use start and failure signals
.../ping/UUID/start before the job additionally measures the run time, a ping to .../ping/UUID/fail actively reports a failure. So you see not just whether but also how long a job ran – useful for spotting backups that are getting slower over time.Step 7: Set up notifications
An alert is only useful if it reaches you. Under Integrations you connect channels: email (set the SMTP environment variables for it), ntfy, Telegram, webhooks and many more. For the self-hosting stack ntfy is the obvious choice – push to your phone, without a third-party service. Set up at least one channel and assign it to your checks, otherwise the “down” status stays silent.
When things go wrong
Container won’t start: “unable to open database file”. DB_NAME: /data/hc.sqlite is missing or the data folder isn’t owned by UID 1000. Set the path and chown -R 1000:1000 /opt/healthchecks/data (see the warning in step 2).
The page responds with HTTP 500. Most common cause: a non-ASCII character in SITE_NAME (or another text environment variable). Switch to pure ASCII and restart. To diagnose, temporarily set DEBUG: "True" – but switch it back to False afterwards.
Login fails / CSRF error on submit. CSRF_TRUSTED_ORIGINS: https://YOUR_DOMAIN must be set – Django otherwise rejects POST requests behind the reverse proxy. And ALLOWED_HOSTS must contain your domain exactly.
The check won’t turn “green” even though the job runs. Check whether the curl ping actually runs and hits the right UUID: curl -v https://YOUR_DOMAIN/ping/UUID should return OK. On the detail page the log shows whether and from which IP pings arrive.
I get no notification on “down”. No integration channel is assigned, or (for email) the SMTP settings are missing. Set up a channel under “Integrations” and assign it to the check.
Maintenance & backups
- Updates. Occasionally bump the image tag (
healthchecks/healthchecks:v4.4) to the current version anddocker compose up -d; the database migrates automatically at start. Your normal update process handles the rest. - Backup. The entire state lives in the SQLite file under
data/– add it to your Restic backup. A small but neat side effect: Healthchecks then monitors the backup that backs it up – close the loop by having the backup job also ping a Healthchecks check. - Who watches the watchman? Healthchecks itself has to be running to alert. So add it to Uptime Kuma as an HTTP monitor – the two tools then cover each other: Kuma checks that Healthchecks is reachable, Healthchecks checks that your jobs ran.
Send feedback: feedback@serverkueche.de
You might also like

Homepage: The Dashboard for All Your Self-Hosted Services
A tidy start dashboard for your server: Homepage links every service, shows system load and the live Docker container …

ntfy: push notifications from your own server to your phone
Self-host ntfy with Docker & Traefik: push messages to your phone via a simple curl – ideal for backup reports, …

Self-hosting Immich: your private photo backup behind Traefik
Set up Immich with Docker behind Traefik: the self-hosted alternative to Google Photos – with automatic phone backup, …