Monitoring with Grafana & Prometheus: your server in live dashboards
A complete monitoring stack of Prometheus, node-exporter, cAdvisor and Grafana behind Traefik – with live metrics for host and containers.
Table of contents
Uptime Kuma tells you whether a service is running. This stack tells you how it’s doing: CPU, RAM, disk, network and the load of each individual container – as live dashboards with history. We build the combination that has become the de facto standard in self-hosting: Prometheus collects, Grafana shows.
What are we building?
By the end, a complete monitoring stack runs behind your Traefik proxy, reachable at
https://grafana.YOUR_DOMAIN with valid HTTPS. Four building blocks interlock:
- Prometheus 3.14 – the time-series database. It pulls (scrapes) metrics from the other services at intervals and stores them with a timestamp.
- node-exporter 1.12 – delivers the host metrics: CPU, memory, load, disks, network interfaces.
- cAdvisor 0.60 – delivers the container metrics: CPU and RAM per running container, so you see which service is eating.
- Grafana 13.2 – the interface: ready-made dashboards that turn the Prometheus data into graphs and displays.
The decisive difference from Uptime Kuma: instead of “green/red” you get trends – you recognize that the RAM has been slowly filling up for days, before the server swaps. Only Grafana is reachable from outside; Prometheus, node-exporter and cAdvisor get no public route.
How big does the server need to be?
VPS 2000 G12.5
8 vCores · 16 GB RAM · 256 GB SSD
from €26.92/month
Enough RAM and storage to run monitoring alongside your apps.
💶 1 month free:
Single use, valid for VPS 2000 G12.5. Redeem in the cart →
💶 €5.95 voucher for new netcup customers: always valid · not for domains or VPS Lite
Prerequisites
- Confidence with Docker Compose – services, volumes, networks. If that’s still new: understanding Docker Compose.
- A running Traefik reverse proxy with the shared
proxynetwork and the Let’s Encrypt resolverle– set up as in reverse proxy with Traefik. - A subdomain
grafana.YOUR_DOMAINwhose DNS record (A/AAAA) points to your server IP – see connecting a domain to your server.
Step by step
Step 1: Understand the architecture
Before we create files, the picture behind it – otherwise you debug blind. Prometheus works
on the pull principle: the services don’t send their values somewhere, but Prometheus
queries them actively. Every “exporter” provides its metrics under /metrics, Prometheus
fetches them every 15 seconds and stores them in its time-series database. Grafana in turn
queries Prometheus and draws the graphs from it.
Why pull instead of push at all? Because this way Prometheus always knows whether a target is
alive: if an exporter doesn’t respond, that’s itself information (up = 0). You need no
agents that actively “phone home”, and you can simply enter every new target into the
configuration. An exporter is nothing magical – it’s a tiny web server that delivers a text
list of current measurements under /metrics.
From this follows the security rule of this setup: node-exporter, cAdvisor and Prometheus have
no authentication. So they must never stand open on the internet. Prometheus and
cAdvisor we bind only to the internal Docker network monitoring; node-exporter runs in the
host network (why is explained in step 4), but stays unreachable from outside thanks to
UFW and the
netcup firewall. Only Grafana is additionally on the
proxy network and gets a Traefik route – the only service with a login and a public address.
Step 2: Create the project folder and configure Prometheus
Create the folder structure:
mkdir -p ~/monitoring/prometheus ~/monitoring/grafana/provisioning/datasources
cd ~/monitoring
Create the Prometheus configuration. It defines whom Prometheus queries at what interval:
# prometheus/prometheus.yml
global:
  scrape_interval: 15s
  scrape_timeout: 10s

scrape_configs:
  - job_name: prometheus
    static_configs:
      - targets: ["localhost:9090"]

  - job_name: node
    static_configs:
      - targets: ["host.docker.internal:9100"]

  - job_name: cadvisor
    static_configs:
      - targets: ["cadvisor:8080"]
Important: cadvisor:8080 appears as a service name – Docker resolves it automatically in
the shared monitoring network. The node-exporter, on the other hand, runs in the host
network (step 4 explains why) and is therefore addressed via host.docker.internal:9100 –
Prometheus gets this name mapped to the Docker host’s IP via extra_hosts shortly.
scrape_interval: 15s is a good compromise – often enough for meaningful curves, seldom
enough to hardly create load.
Step 3: Provision the Grafana data source automatically
Instead of clicking the Prometheus data source into Grafana by hand later, we set it up via provisioning – as a file. That’s reproducible: after a rebuild, everything is immediately back, without clicking.
# grafana/provisioning/datasources/datasource.yml
apiVersion: 1

datasources:
  - name: Prometheus
    type: prometheus
    access: proxy
    url: http://prometheus:9090
    isDefault: true
    editable: false
access: proxy means that Grafana itself (server-side) queries Prometheus – the user’s
browser never talks to Prometheus directly. That’s exactly why Prometheus can stay internal.
Step 4: The Compose stack
Now the heart. Create the compose.yaml. Replace grafana.YOUR_DOMAIN and the Grafana
password:
services:
  prometheus:
    image: prom/prometheus:v3.14.0
    container_name: prometheus
    command:
      - "--config.file=/etc/prometheus/prometheus.yml"
      - "--storage.tsdb.path=/prometheus"
      - "--storage.tsdb.retention.time=30d"
    volumes:
      - ./prometheus/prometheus.yml:/etc/prometheus/prometheus.yml:ro
      - prom_data:/prometheus
    extra_hosts:
      - "host.docker.internal:host-gateway"
    networks: [monitoring]
    restart: unless-stopped

  node-exporter:
    image: prom/node-exporter:v1.12.1
    container_name: node-exporter
    command:
      - "--path.rootfs=/host"
    network_mode: host
    pid: host
    volumes:
      - "/:/host:ro,rslave"
    restart: unless-stopped

  cadvisor:
    image: ghcr.io/google/cadvisor:v0.60.6
    container_name: cadvisor
    privileged: true
    devices:
      - /dev/kmsg
    volumes:
      - /:/rootfs:ro
      - /var/run:/var/run:ro
      - /sys:/sys:ro
      - /var/lib/docker/:/var/lib/docker:ro
      - /dev/disk/:/dev/disk:ro
    networks: [monitoring]
    restart: unless-stopped

  grafana:
    image: grafana/grafana:13.2.2
    container_name: grafana
    depends_on: [prometheus]
    environment:
      GF_SECURITY_ADMIN_USER: admin
      GF_SECURITY_ADMIN_PASSWORD: YOUR_GRAFANA_PASSWORD
      GF_SERVER_ROOT_URL: https://grafana.YOUR_DOMAIN
      GF_USERS_ALLOW_SIGN_UP: "false"
    volumes:
      - grafana_data:/var/lib/grafana
      - ./grafana/provisioning:/etc/grafana/provisioning:ro
    labels:
      - "traefik.enable=true"
      - "traefik.http.routers.grafana.rule=Host(`grafana.YOUR_DOMAIN`)"
      - "traefik.http.routers.grafana.entrypoints=websecure"
      - "traefik.http.routers.grafana.tls.certresolver=le"
      - "traefik.http.services.grafana.loadbalancer.server.port=3000"
    networks: [monitoring, proxy]
    restart: unless-stopped

volumes:
  prom_data:
  grafana_data:

networks:
  monitoring:
  proxy:
    external: true
What matters here:
--storage.tsdb.retention.time=30dkeeps metrics for 30 days. More = more meaning, but also more storage. 30 days is a good start.- node-exporter needs the host root directory (
/:/host:ro,rslave),pid: hostandnetwork_mode: hostto read real host values instead of container values.--path.rootfs=/hosttells it where the host view is (read-only,:ro). The host network isn’t a nice-to-have:/proc/netis bound to the network namespace – in a normal bridge network, node-exporter would see only its own container interface (effectively just the scrape traffic), not the real host interfaces. The price: node-exporter thus listens on port9100of the host – your firewall keeps the port closed from outside, and Prometheus reaches it via theextra_hostsentry (host-gateway). - cAdvisor needs
privileged: true, the device/dev/kmsgand read mounts on/sysand/var/lib/dockerto detect all containers. That’s unavoidable for container monitoring – that’s why cAdvisor stays strictly internal. Mind the registry: current cAdvisor images live atghcr.io/google/cadvisor. The older addressgcr.io/cadvisor/cadvisor, which many guides still show, is no longer being filled –v0.55.1is the last tag there. - Only
grafanacarries Traefik labels and is on theproxynetwork. The internal port is 3000.GF_SERVER_ROOT_URLmust be the public HTTPS address, otherwise logins and redirects break behind the proxy. GF_USERS_ALLOW_SIGN_UP: "false"prevents strangers from creating their own account. Set a strong admin password – Grafana is publicly accessible.
Step 5: Start and check the Prometheus targets
Start the complete stack:
docker compose up -dThe first time, Docker downloads four images – that takes a moment. Check that all containers are running:
docker compose psThe STATUS column shows an Up … for all four services; cAdvisor ships its own health check
and additionally reports (healthy):
NAME            IMAGE                             SERVICE         STATUS
cadvisor        ghcr.io/google/cadvisor:v0.60.6   cadvisor        Up 20 minutes (healthy)
grafana         grafana/grafana:13.2.2            grafana         Up 20 minutes
node-exporter   prom/node-exporter:v1.12.1        node-exporter   Up 20 minutes
prometheus      prom/prometheus:v3.14.0           prometheus      Up 20 minutes
(The COMMAND, CREATED and PORTS columns are omitted here for readability.) Now the
decisive test: Does Prometheus see its targets? Since Prometheus stays internal, we query
it from a short-lived container that’s on the same network (Compose calls the network
monitoring_monitoring – project folder plus network name):
docker run --rm --network monitoring_monitoring curlimages/curl:8.22.0 \
  -s http://prometheus:9090/api/v1/query?query=up
In the JSON response there’s a "value" with "1" for each target – that means “reachable”.
In the test all three jobs (prometheus, node, cadvisor) returned a 1. A 0 means
Prometheus can’t scrape the target – then the section “When things go wrong” helps.
Step 6: Open Grafana and import dashboards
Open https://grafana.YOUR_DOMAIN. Traefik fetches the certificate on the first access (a few
seconds). Log in with admin and your password from the compose.yaml. Thanks to
provisioning, the Prometheus data source is already connected – you find it under
Connections → Data sources:
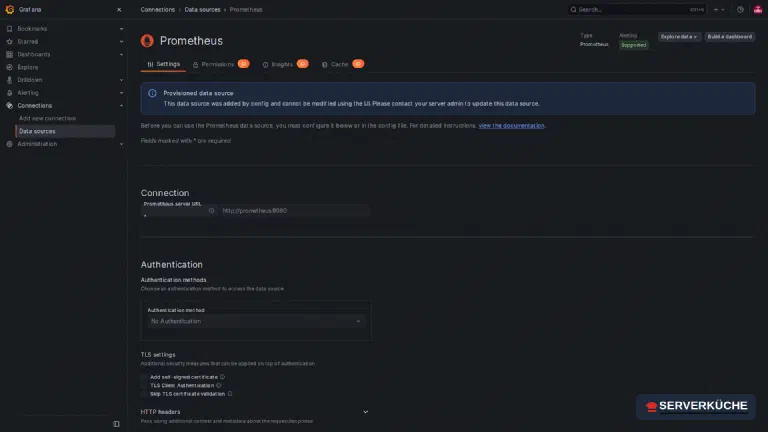
Now the dashboards. Instead of building panels ourselves, we import two proven ones from the Grafana community. Go to Dashboards → New → Import, enter the ID and click Load:
")
Import these two:
- 1860 – “Node Exporter Full”: the comprehensive host dashboard.
- 19792 – “cAdvisor Dashboard”: metrics per container.
For 19792, the import form additionally asks for the data source under DS_PROMETHEUS –
pick Prometheus there. The field starts out empty and the Import button still looks
clickable: click it with nothing selected and Grafana aborts with A data source is required
below the field instead of importing. “Node Exporter Full”, by contrast, carries the data
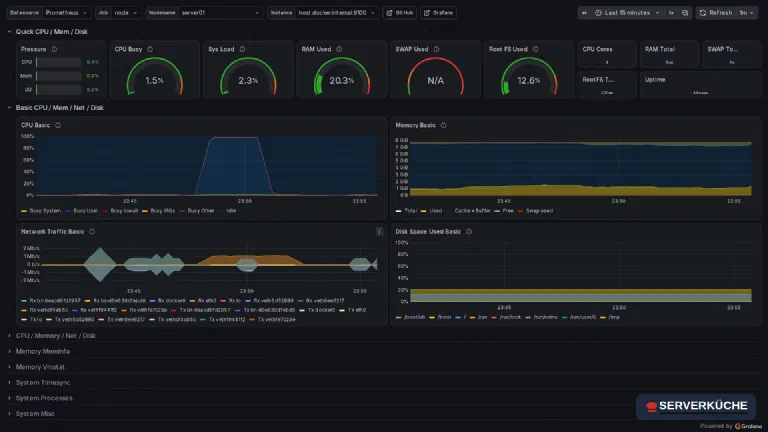
source as a dashboard variable and doesn’t ask on import at all. After that, “Node Exporter
Full” shows your host in real time – CPU usage, used RAM, disk, network, uptime:
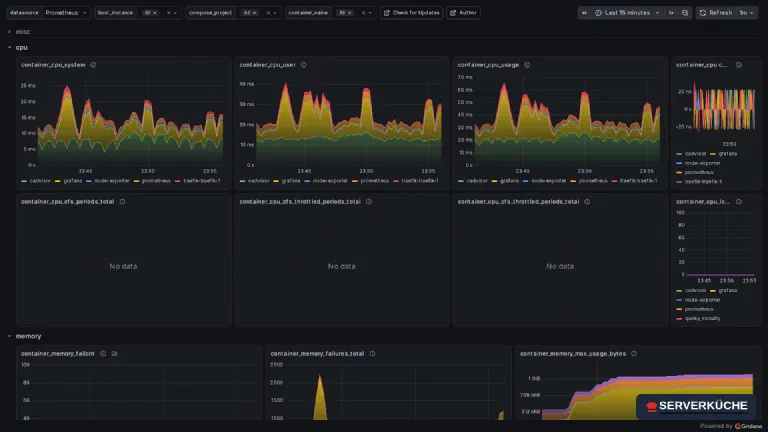
The cAdvisor dashboard breaks the same load down to individual containers – here you immediately see which service draws how much CPU and RAM:
Provision dashboards too
grafana/provisioning/dashboards/ a .yml plus the dashboard JSONs). For getting started, the
import via ID is faster; once your setup is in place, provisioning is worth it so all dashboards
are automatically back after a rebuild.Step 7: Read the most important metrics correctly
A dashboard full of curves is of little use if you don’t know what to watch for. These five values in the “Node Exporter Full” dashboard tell you almost everything about the health of your server:
- CPU Busy. Short spikes are normal. It gets critical when the usage stays permanently high – then the server is the bottleneck.
- Sys Load. Careful, the reading is a percentage: the panel relates the 1-minute load to the number of your cores (4 in the test). So 100% means “all cores are busy” – permanently above that, more processes are waiting than the server can work through.
- RAM Used. Important: Linux uses free memory as a file cache – so “used” isn’t the same as “tight”. Only when little stays free besides the cache and SWAP Used rises does the server get sluggish. It’s exactly this creeping rise you want to see early.
- Root FS Used. The classic among server outages is the full disk. The trend shows you the fill rate – so you recognize days in advance when it’s getting tight.
- Network Traffic. Unusual spikes even though nothing is running can indicate a backup, an update or – in the bad case – unwanted traffic.
In the cAdvisor dashboard the most exciting question is: Which container draws the load? If your server suddenly gets slow, you see here at a glance whether it’s due to a single app – and don’t have to guess. This turns “something is slow” into a targeted “the photo import in container X is eating the CPU right now”.
When things go wrong
A target is at up = 0 or “DOWN” in Prometheus. Prometheus can’t reach the exporter. For
cadvisor, check that it’s on the same monitoring network and the name and port are exactly
right (cadvisor:8080). For the node job, check the extra_hosts entry on the Prometheus
service and the target host.docker.internal:9100 – without both, Prometheus doesn’t find the
node-exporter in the host network. After changes to the prometheus.yml, restart the
Prometheus container: docker compose restart prometheus.
The cAdvisor dashboard partly shows “No data” or cAdvisor won’t start. If the mounts or
privileged: true are missing, cAdvisor doesn’t see the containers. Check the cadvisor block
(mounts, devices: /dev/kmsg). Individual “No data” panels are normal – some metrics (like CPU
throttling) only exist if you’ve set CPU limits on the containers.
Grafana doesn’t load correctly behind Traefik – login fails or the layout is broken. Almost
always GF_SERVER_ROOT_URL is wrong. It must be exactly the public address
(https://grafana.YOUR_DOMAIN). Also check that the Traefik label
loadbalancer.server.port=3000 is set – Grafana listens on 3000 internally.
Grafana shows “No data” in the panels, even though the targets are up. Usually the time
range. A fresh stack has no history yet – set “Last 15 minutes” at the top right and wait a few
minutes for data to accumulate. Also check that the Prometheus data source was selected on
dashboard import.
The disk space on the server grows steadily. That’s the Prometheus TSDB. Reduce
--storage.tsdb.retention.time (e.g. to 15d) or monitor fewer targets. The prom_data
volume grows with the number of metrics × retention time.
Your problem is not listed? Search all error messages →
Maintenance & backups
- What you must back up. Important is the
grafana_datavolume: it contains your users, settings and self-built dashboards. Back it up encrypted and off-site with Restic. The Prometheus metrics (prom_data) are pure measurements – a loss is bearable, a backup optional. - Updates. The image tags are pinned (
prometheus:v3.14.0,grafana:13.2.2…). To update, raise the tags, thendocker compose pull && docker compose up -d. Read the release notes first – Grafana in particular occasionally changes defaults between major versions. You get cAdvisor fromghcr.io/google/cadvisor; new tags only appear there now, no longer undergcr.io/cadvisor/cadvisor. - Security. Grafana is publicly accessible – assign a strong admin password and leave
GF_USERS_ALLOW_SIGN_UPatfalse. Prometheus and cAdvisor stay internal; don’t expose them “just quickly” for debugging, they have no authentication. - The next step: alerts. A dashboard only helps if you look at it. Grafana can trigger alerts itself at thresholds (RAM > 90%, disk almost full) and report e.g. via push. This turns the pretty dashboard into an early-warning system – a good connection to your existing Uptime Kuma.
- Honest about the effort: the stack runs largely on its own after setup. Occasionally plan a look at the retention time and storage usage, and bump the versions roughly quarterly.
Last updated: Oct 19, 2026
Send feedback: feedback@serverkueche.de
You might also like