Installing Uptime Kuma: server monitoring behind Traefik
Set up Uptime Kuma behind Traefik and monitor your services: monitors, notifications and a status page – the first real app of the series.
Table of contents
Traefik is up – now we hang the first real app behind it. Uptime Kuma is ideal for that: tiny, immediately useful and without a database. It monitors your services and raises the alarm when one fails – from now on you notice first that something is stuck, not your users. Along the way you learn the pattern every further app repeats.
What are we building?
By the end, Uptime Kuma 2.5.6 runs at https://status.YOUR_DOMAIN, secured via Traefik
with automatic HTTPS. You’ve set up the first monitor (which checks every minute whether a
service responds), connected a notification and optionally a public status page. For the
first time we bind a service that doesn’t listen on port 80 – an important detail for all
the following apps.
Prerequisites
- A running Traefik reverse proxy including the
proxynetwork and a working Let’s Encrypt resolverle - A DNS record
status.YOUR_DOMAINthat points to the server
Step by step
Step 1: The compose.yaml
Own folder, own file:
mkdir -p ~/uptime-kuma && cd ~/uptime-kumaservices:
uptime-kuma:
image: louislam/uptime-kuma:2.5.6
volumes:
- kuma-data:/app/data
networks:
- proxy
labels:
- "traefik.enable=true"
- "traefik.http.routers.kuma.rule=Host(`status.YOUR_DOMAIN`)"
- "traefik.http.routers.kuma.entrypoints=websecure"
- "traefik.http.routers.kuma.tls.certresolver=le"
- "traefik.http.services.kuma.loadbalancer.server.port=3001"
restart: unless-stopped
volumes:
kuma-data:
networks:
proxy:
external: trueYou know this from the Traefik tutorial – except for one new, decisive line:
- "traefik.http.services.kuma.loadbalancer.server.port=3001"Uptime Kuma listens internally on port 3001, not on 80. This line tells Traefik which
port to forward the requests to. Without it, Traefik guesses wrong and you get a Bad Gateway. Remember the label – every app that doesn’t run on port 80 needs it.
The rest is the familiar pattern: no ports: (only reachable via Traefik), proxy
network, named volume for the data.
Step 2: Start and first login
docker compose up -d
docker compose logs -f uptime-kuma
When Kuma is ready, the log ends with Waiting for user action... – from here the service
waits for the initial setup in the browser (Ctrl+C only ends the following):
Welcome to Uptime Kuma
Your Node.js version: 22.22.3
2026-10-15T23:35:13Z [SERVER] INFO: Env: production
2026-10-15T23:35:13Z [SERVER] INFO: Uptime Kuma Version: 2.5.6
2026-10-15T23:35:13Z [SERVER] INFO: Loading modules
2026-10-15T23:35:15Z [SERVER] INFO: Creating express and socket.io instance
2026-10-15T23:35:15Z [SERVER] INFO: Server Type: HTTP
2026-10-15T23:35:15Z [SERVER] INFO: Data Dir: ./data/
2026-10-15T23:35:15Z [SETUP-DATABASE] INFO: db-config.json is not found or invalid: ENOENT: no such file or directory, open 'data/db-config.json'
2026-10-15T23:35:15Z [SETUP-DATABASE] INFO: Starting Setup Database
2026-10-15T23:35:15Z [SETUP-DATABASE] INFO: Listening on:
2026-10-15T23:35:15Z [SETUP-DATABASE] INFO: -  http://localhost:3001
2026-10-15T23:35:15Z [SETUP-DATABASE] INFO: -  http://172.18.0.3:3001
2026-10-15T23:35:15Z [SETUP-DATABASE] INFO: Waiting for user action...
The line about db-config.json reads like an error but is exactly the expected
behaviour on the very first start: the file is only created once you pick a database
in the browser in a moment. The addresses behind “Listening on” are the container’s –
from outside you come in through Traefik, not through them.
Kuma does not create the database yet – it deliberately waits for your choice in the
browser. So open https://status.YOUR_DOMAIN. Uptime Kuma 2.x first asks for the
database – for a setup like ours, SQLite is the right, simplest choice (select it,
click Next). Right after that you create the admin account (username + strong
password).
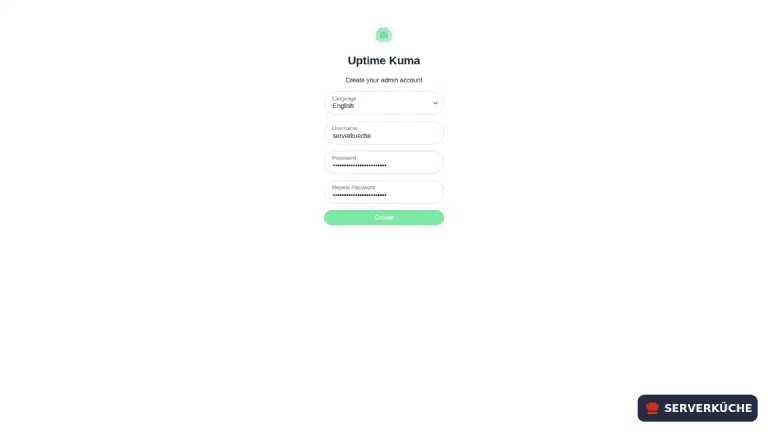
Create the admin account immediately
Step 3: Create the first monitor
A monitor is a recurring check. Click Add New Monitor and create one for Traefik itself:
- Monitor type:
HTTP(s) - Friendly name:
Traefik Dashboard - URL:
https://traefik.YOUR_DOMAIN - Heartbeat interval:
60seconds - Authentication: the Traefik dashboard is protected by basic auth (step 7 of the
Traefik tutorial) – so at the very bottom, in the
Authentication section, pick HTTP Basic Auth under Method and enter the user and
password. Without credentials, Kuma only gets
401and reports the monitor as Down.
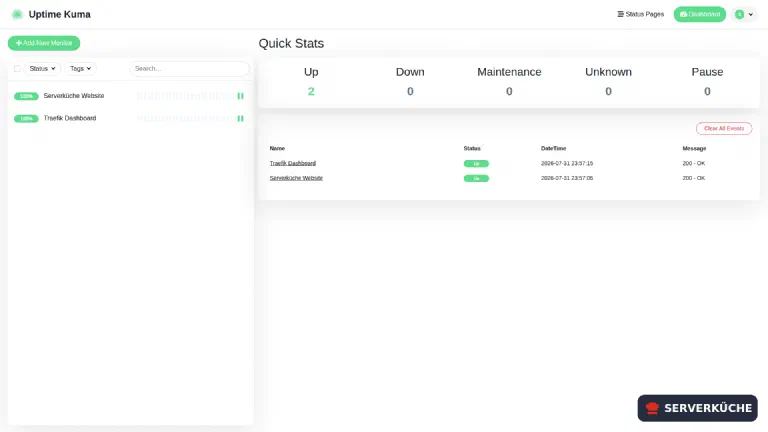
Save – after a few seconds the monitor is Up (green) and shows the response time.
Besides the simple HTTP(s) check, it pays to choose the matching monitor type:
- HTTP(s) – Keyword: additionally checks whether a certain word appears in the response text. This detects “the server responds, but shows an error page”.
- TCP port: for services without a web interface (e.g. a database, an SSH port). Only checks whether the port is open.
- Ping: the simplest reachability test via ICMP.
- Docker container: checks the container status directly via the Docker socket – handy for internal services without their own domain.
- Push: here the monitored service calls Kuma regularly. Ideal for cron jobs and backups: if the script doesn’t report in time, Kuma raises the alarm (“dead man’s switch”).
Create the matching monitor for every important service.
Tip
https://…), not via localhost. This way
you simultaneously test that Traefik and the certificate work from outside – not just that
the container is running.For the HTTP(s) monitor, the option “Certificate Expiry Notification” (in the
Advanced section) is also worth it:
Kuma then warns in good time before a TLS certificate expires. For services behind Traefik,
Let’s Encrypt renews automatically – but this very automation occasionally fails silently (a
DNS record is changed, port 80 accidentally closed). The monitor is your safety net and
reports in while there are still days to fix it, instead of visitors suddenly facing a
certificate warning.
Step 4: Set up notifications (email and Telegram)
A monitor without an alarm is just a pretty chart. Under Settings → Notifications → Set Up Notification you create a channel. Uptime Kuma supports over 100 – we set up the two most common completely: email for the classic message and Telegram for push straight to the phone.
Email (SMTP)
Choose “Email (SMTP)” as the notification type and enter your mail provider’s data:
- Hostname / Port: e.g.
smtp.YOUR_PROVIDER.comand587 - Security: exactly two entries to pick from –
None / STARTTLS (25, 587)for port 587 (Kuma negotiates STARTTLS itself) andTLS (465)for port 465 - Username / Password: your SMTP credentials
- From Email / To Email: which address the warning comes from and which it’s sent to
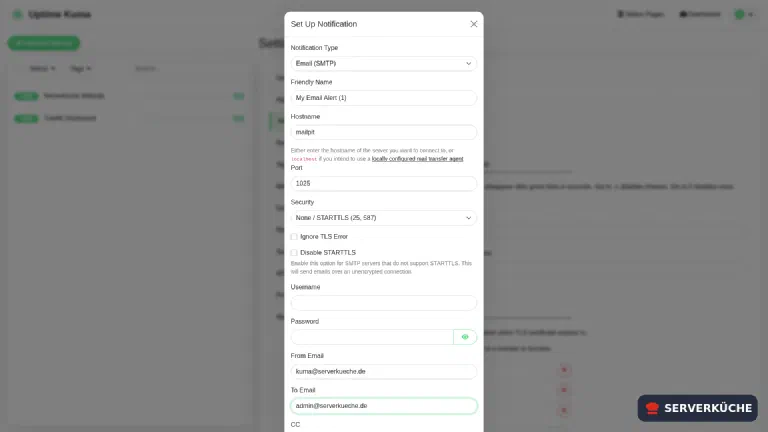
Click Test – within a few seconds a test message lands in the mailbox. Only when it really arrives are the credentials and port correct. Don’t forget to save.
Telegram
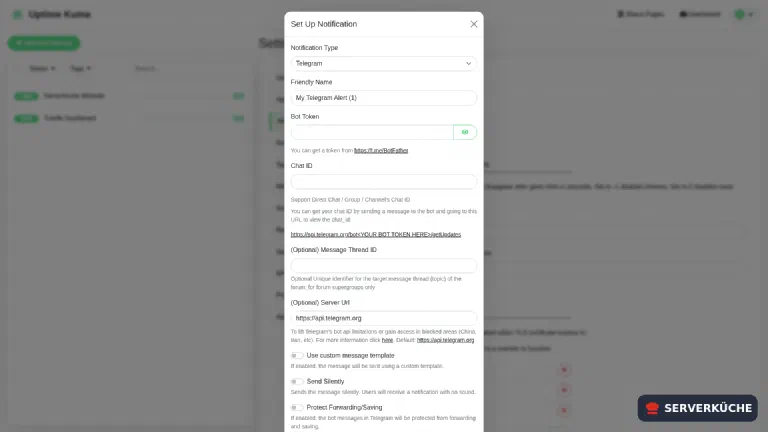
Telegram is ideal for instant push alerts to the phone – without your own mail server. You need two pieces of information:
- Bot Token: message @BotFather in Telegram, send
/newbot, assign a name – BotFather replies with the token. - Chat ID: send your new bot any message, then open
https://api.telegram.org/bot<YOUR_TOKEN>/getUpdatesin the browser and read thechat.idfrom the response.
Enter the token and chat ID into the Telegram notification (Uptime Kuma links both helpers directly in the dialog) and click Test – the message should appear in the chat immediately.
Otherwise the alarm stays silent
If you want push messages entirely under your own control (without a Telegram server), take ntfy – self-hosted, with its own recipe in the series. Kuma knows it as the built-in notification type Ntfy.
Step 5: A public status page (optional)
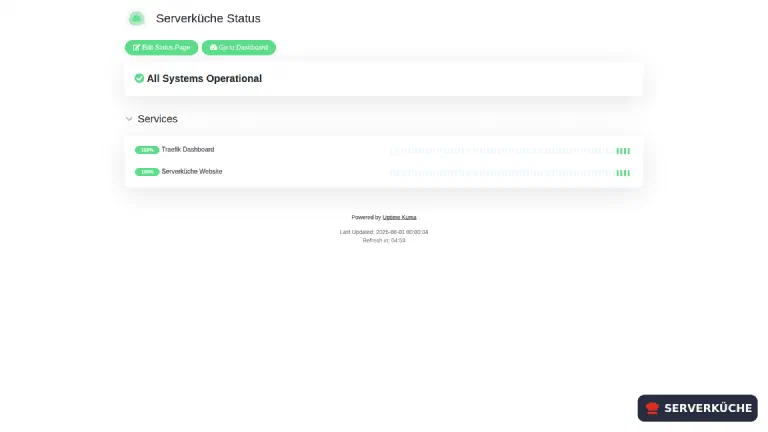
Kuma can publish a status page where visitors see whether your services are running. Here’s how:
- Status Pages → New Status Page, then assign a name (e.g. “Serverküche Status”) and
a slug (the URL, e.g.
serverkueche) and click Next. - In the editor, Add Group (e.g. “Services”), and below it, add the desired monitors via the selection field.
- Save at the top right – done. The page is then publicly reachable at
https://status.YOUR_DOMAIN/status/serverkueche.
Only include what really everyone may see – better leave internal services out.
Step 6: Avoid false alarms – fine-tune the alarm behavior
A monitor that raises the alarm at every brief network hiccup is quickly ignored – and then you miss the real outage. In the monitor form you set the behavior appropriately:
- Retries: the service only counts as “Down” after n failed checks.
2–3filters out individual dropouts without obscuring real outages for long. - Heartbeat Retry Interval: Kuma may check more often in the error case (e.g. every
20 seconds) to detect recovery quickly. The field only appears once Retries is greater
than
0. - Resend Notification if Down X times consecutively: Kuma reminds you again every X
failed checks as long as a service is down – useful so an outage at night doesn’t get lost
in a single mail.
0turns resending off.
Plan maintenance windows
Step 7: Monitor cron jobs with a push monitor
Classic monitors check from outside whether a service responds. For things that run silently in the background – a nightly backup, a sync script, a cron job – the push monitor flips the principle: not Kuma asks, but your script reports in. If the report fails to come, Kuma raises the alarm – the classic “dead man’s switch”.
Create a monitor of type Push. Kuma then shows you a unique push URL:
https://status.YOUR_DOMAIN/api/push/YOUR_TOKEN?status=up&msg=OK&ping=You call this URL at the end of your script – for example after a successfully completed backup:
# ... your backup command ...
curl -fsS "https://status.YOUR_DOMAIN/api/push/YOUR_TOKEN?status=up&msg=Backup+OK" > /dev/null
Set the check interval in Kuma a bit more generously than your cron cadence (if the
backup runs hourly, give Kuma e.g. 90 minutes of tolerance). If no curl comes in that time,
the monitor goes to Down and you’re notified – so you learn about a backup that did not
run, not only when you urgently need it.
Step 8: Secure the admin login with 2FA
Your Kuma login protects access to all monitors, the stored notification credentials and the status-page configuration – and it’s publicly on the net. So enable two-factor authentication: under Settings → Security → Two Factor Authentication → 2FA Settings. Kuma first asks for your current password; after Enable 2FA the QR code appears, which you scan with an authenticator app (e.g. Aegis or 2FAS). Enter the generated code, click Verify Token and then Save – without that last click, 2FA stays inactive.
Secure the recovery
otpauth:// URI you can store there. If you lose
your phone and have no copy, you can otherwise only get back in via the database in the
kuma-data volume.When things go wrong
Bad Gateway (502) when opening status.YOUR_DOMAIN. Almost always the port label
traefik.http.services.kuma.loadbalancer.server.port=3001 is missing or has a wrong port.
Traefik then reaches the container but knocks on the wrong port. Check the label and run
docker compose up -d again.
404 page not found instead of Kuma. As with every app behind Traefik:
traefik.enable=true set? Container on the proxy network? Is the domain in the Host(...)
rule correct and does the DNS record status.YOUR_DOMAIN point to the server? The Traefik
dashboard shows under “HTTP Routers” whether kuma is registered.
The interface loads, but the live update stutters / breaks off. Kuma uses WebSockets. Traefik forwards those correctly by default – if the problem still occurs, it’s usually an upstream CDN/proxy (e.g. Cloudflare in “proxy” mode) that blocks WebSockets. For direct operation behind Traefik, no extra configuration is needed.
After a re-setup all monitors are gone. The kuma-data volume was deleted (e.g. by
docker compose down -v). All configuration and history lives solely in this volume – that’s
why it’s at the top of the next section.
Your problem is not listed? Search all error messages →
Maintenance & backups
- Back up: the complete heart of Kuma is the
kuma-datavolume (a SQLite database). Back it up regularly – if it’s gone, all monitors and the history are gone. We build the off-site backup for it in the Restic tutorial. - Updates: the
compose.yamlabove pins2.5.6– occasionally bump the tag to the current 2.x version and restart withdocker compose up -d. If you’d rather ride along, enter the tag:2instead of the point version; thendocker compose pull && docker compose up -dpicks up the bug fixes of the 2.x series by itself. Before a jump to a new major version (e.g. later:3), read the release notes and back up the volume first. Your normal update process handles the rest. - Coming from 1.x? The switch to
:2migrates the SQLite database automatically on the first start. You won’t see the database question from step 2 along the way: Kuma finds the existingkuma.dband writes the configuration itself (kuma.db is found, generate db-config.json). After that the log runs the conversion of the history data, line by line marked[DON'T STOP]– and that is meant literally: don’t stop or restart the container while it runs. On a freshly created instance it’s over in seconds; with years of history it takes correspondingly longer – and going back to:1is not intended afterwards. So back up thekuma-datavolume beforehand, then you’re on the safe side. New installations (like above) aren’t affected. - Honest limitation: a monitor that runs on the same server as the monitored services can’t warn you when the whole server fails – then Kuma is offline too. For that case, add an external watcher. Two cheap ways: a second Uptime Kuma on a small server (or at home) that only monitors this instance via HTTP – or a free external ping service that pings your public status page. This way you also get a notice when the whole host is gone – the only case a local monitor inherently can’t cover.
Last updated: Oct 15, 2026
Send feedback: feedback@serverkueche.de
You might also like